Assess the efficiency of your marketing levers
You’ve defined your strategy, your levers are bringing sales opportunities.
But is it all really profitable? With this marketing dashboard, track the number 1 marketing KPI: the volume of deals per lever, as well as the cost of acquisition, sales generated and ROAS.
This will enable you to optimize your marketing strategy and ensure that your budget is properly allocated.

Download your dashboard to track the performance of your marketing levers👇
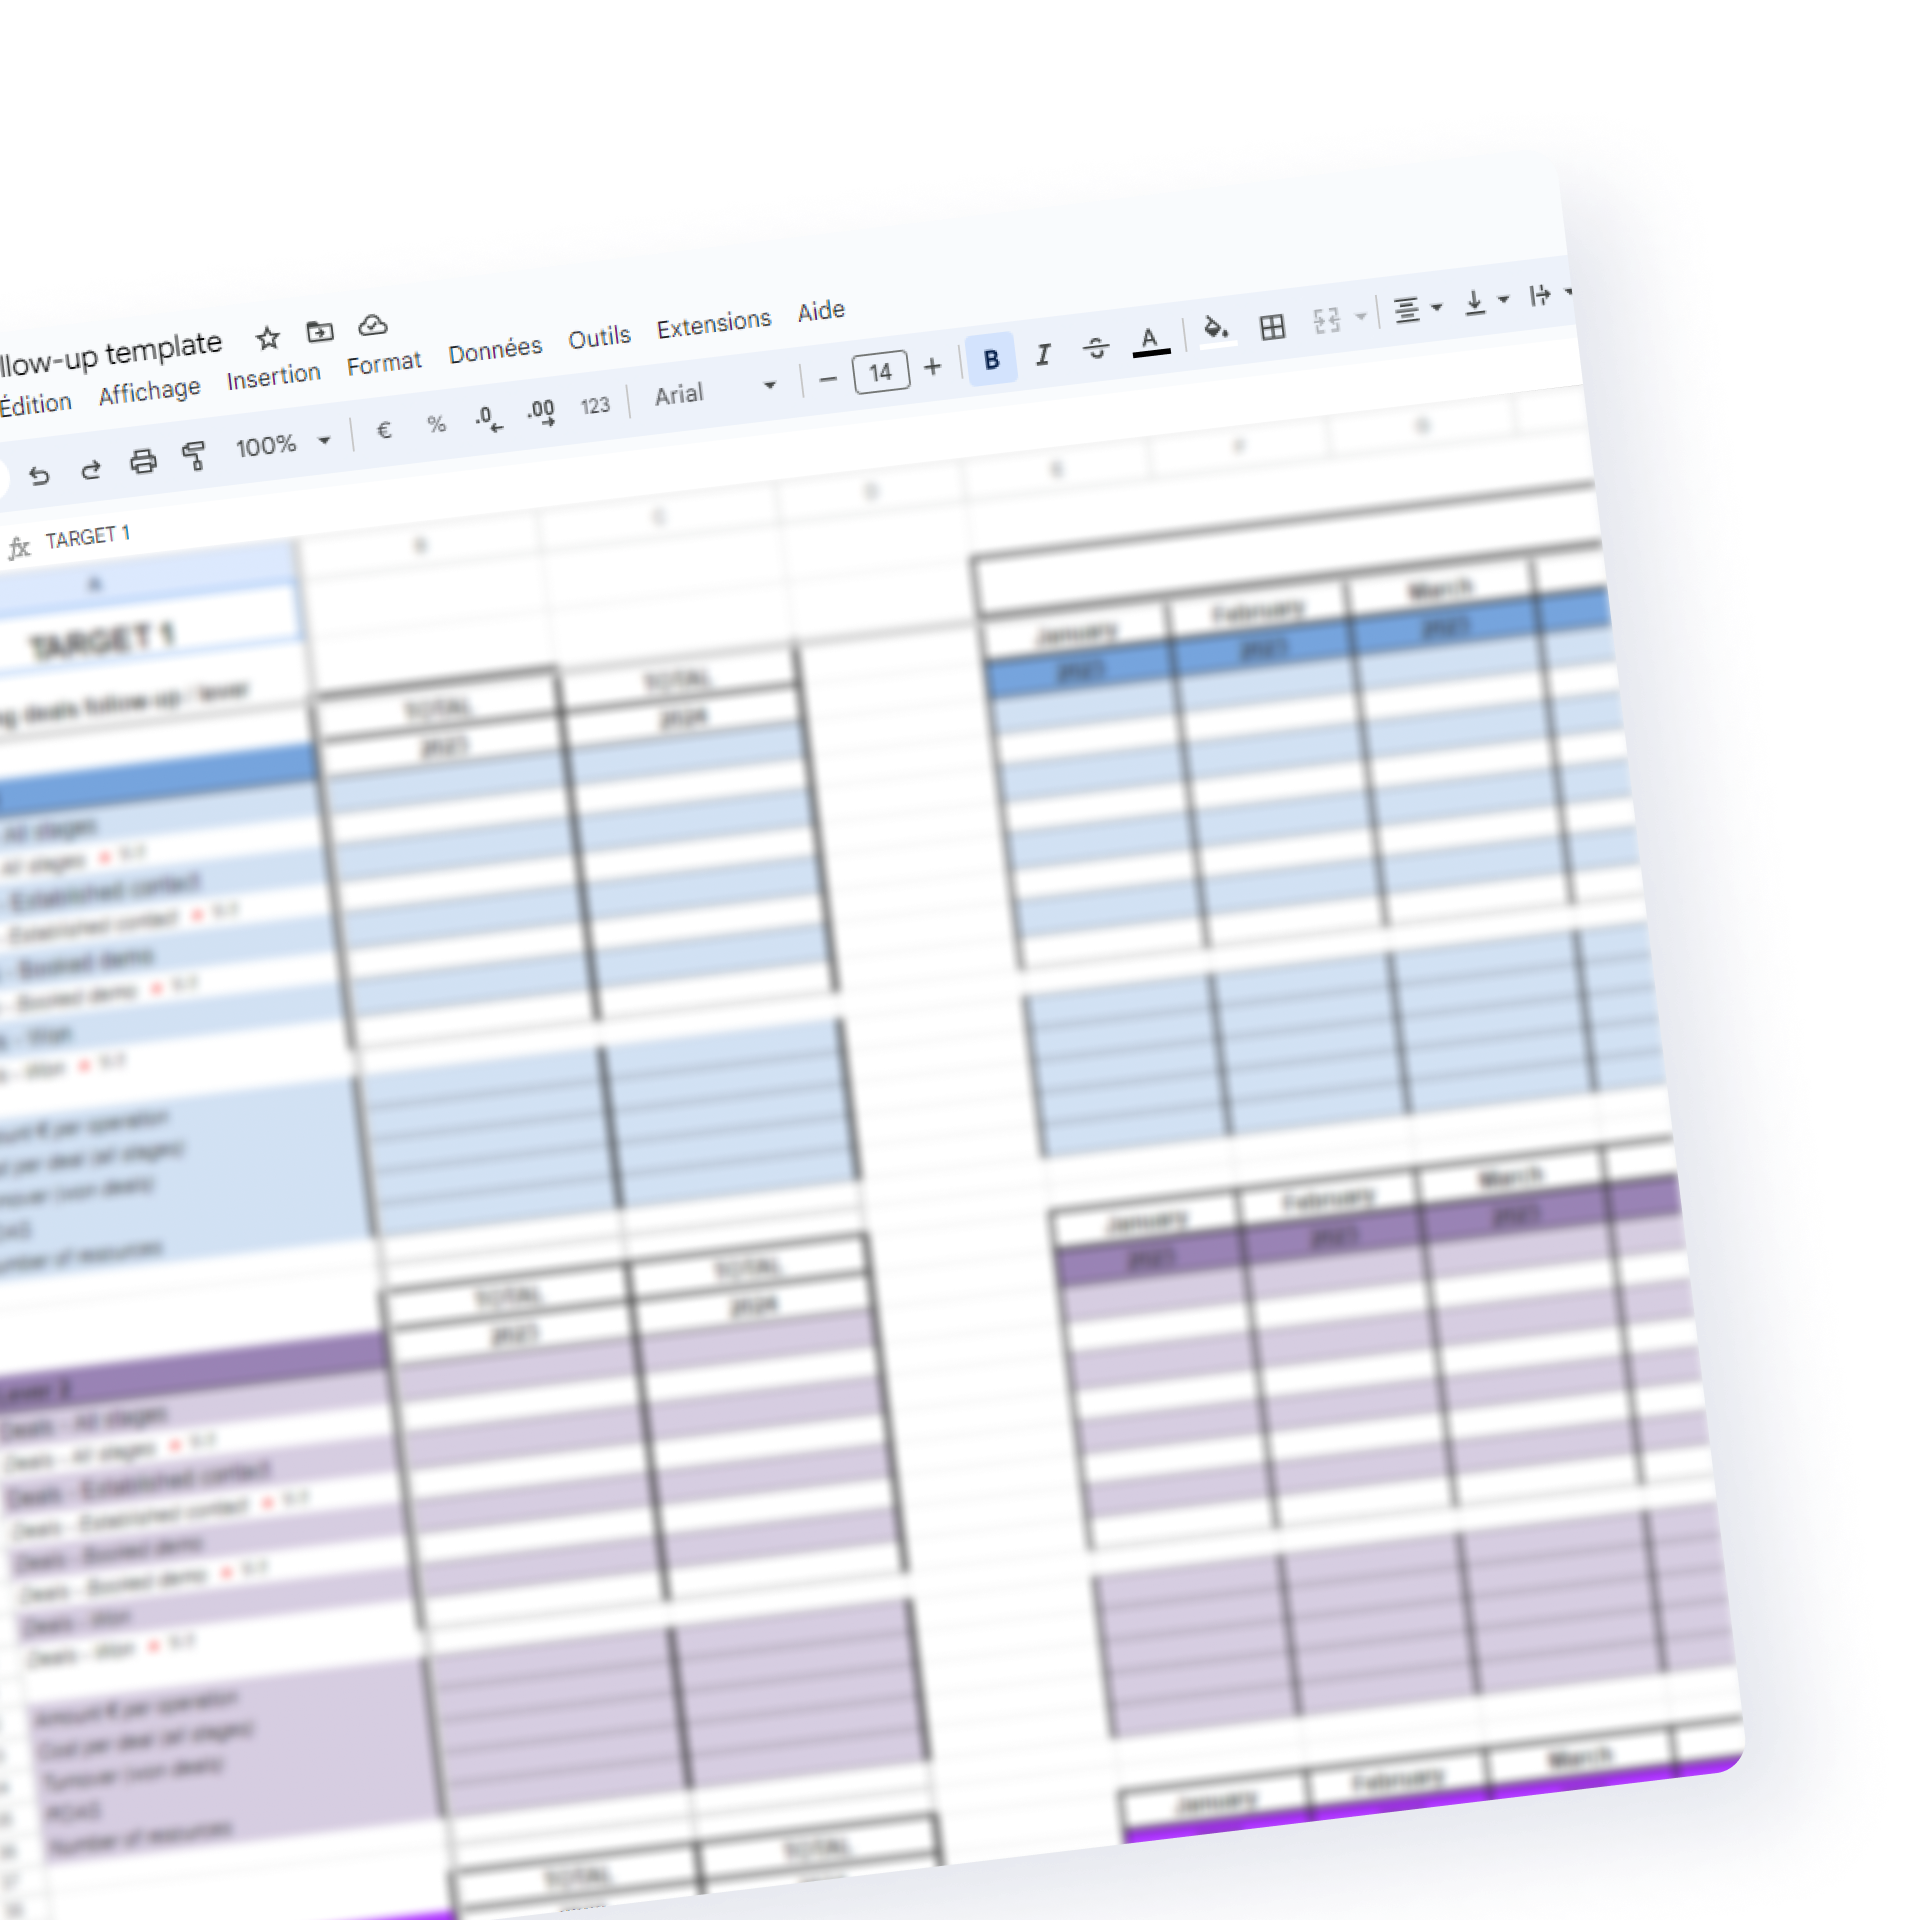
What you’ll find in this marketing dashboard
How to use this marketing opportunities analysis dashboard in concrete terms? The document is a Google Sheet, so all you have to do is copy the tab and you’re free to reuse it! It’s up to you to personalize it with the appropriate lever names, according to your marketing strategy and budget. Then, at the end of each month, all you have to do is add :
- The volume of deals generated, per stage: the model is based on a Hubspot pipe, but you can adjust the terms to suit your CRM.
- Delta vs. previous year’s volumes
- Amount spent per lever, per month
- Sales generated (still per lever, per month)
- Volume of human resources (if you wish)
- Calculation of cost of acquisition and ROAS, if applicable
🎯 Attribution: choose your model
- First touch: conversion is due to the marketing lever that triggered the first interaction with the contact.
- Last touch: in contrast to the first model, conversion is assigned to the final touchpoint identified, before the deal opening or sale.
- Linear: all levers that were relevant in bringing a new prospect are taken into account, with equal weight.
- U-shaped model: the first and last levers are respectively assigned 40% of the conversion weight. The other touch points share the remaining 20%.
- W-shaped model: the lever that enables first contact, the lever that enables conversion into a lead and the lever that enables conversion into an opportunity each receive 30% of the credit. The other contact points share the remaining 10%.
- J-shaped model: the first touchpoint takes a share of 20%; the contact lever just before conversion takes 60%. The remaining 20% are divided between the other levers.
- Time decay: the touchpoints closest to conversion gain more credits.
🔄️ ROAS
- Return On Ad Spent: this marketing metric measures the efficiency of a digital advertising campaign. How is it calculated? Revenue attributed to ads ÷ cost of ads. The result is in monetary units. Basically, you’ll know how many dollars you’ve generated for every 1 dollar spent.
- And what about ROI? To find out more about the difference between ROAS and ROI, discover a dedicated article right here.
👑 Why providing a multi-criteria ranking at the end of the sheet?
- To offer your internal contacts different ways of reading, analyzing and making decisions.
Do you decide to increase the budget of the lever with the best ROAS, or on the one that gives you the highest volume of opportunities? - In this dashboard, you can highlight the top 10 levers according to opportunity stage, number of sales generated or ROAS.
💰 The acquisition cost: to do this, you need to know the cost of the campaign being carried out. There are several schools of thought here:
- Version without personnel costs: if the payroll is managed in a separate budget account, you’ll only need to take into account the costs of software, design, space purchases, etc.
In this case, an intermediate version proposed in this dashboard would be to record on a line the volume of human resources required, to be able to bring the notion of time spent back into the balance when you draw conclusions. - Version with HR costs: in this case, you’ll have a very precise view of the cost of the operation. But you’ll need to think carefully beforehand about how you’re going to allocate personnel costs.
If, for example, you have one person working on several levers simultaneously, you’ll need to be able to measure the time spent per lever, per month.
Similarly, if several people in the department work on a lever, you’ll need to take into account the whole team.
Going further with this marketing dashboard
With this tool, not only can you monitor the key performance indicator of opportunity generation, but you will also get a reading grid for optimizing your marketing levers. Ultimately, the hardest part will be ensuring that the data to populate your marketing dashboard is available: identifying the source(s) of an opportunity, especially if it’s physical, can sometimes be tricky, depending on your attribution model. At Adrenalead, we’ve added a source in addition to the original Hubspot source, which can be fill in by the sales or marketing teams, as meetings and appointments take place. Our opportunity tracking is based on this field, which is filled in automatically when the source is digital and then by hand when the source goes off the digital tracking radar 😉